Traceable
with OneNet Inc.
2020
UI Design
Working directly with the lead designer for Traceable, I helped explore and refine some rather complicated feature concepts for their product security web-app.
Context
We met with the team at Traceable a number of times, and they helped us better understand the data they were trying to visualize. What they were struggling with as a team was how to visualize various types of complex data. Our team was brought in as an outside influence that could help their developers conceive of different ways to organize and explore complex maps, node pathways, and time-based visualizations.
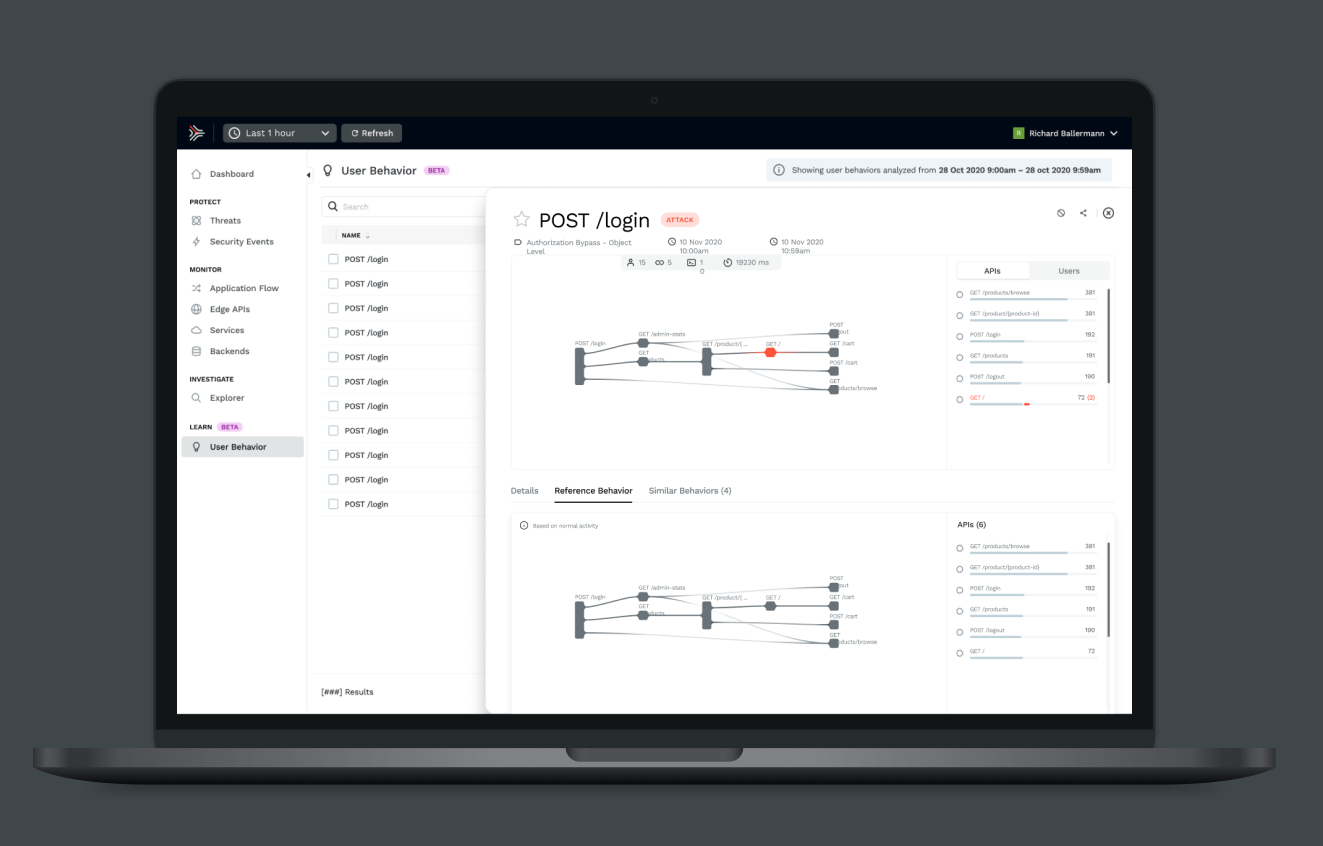
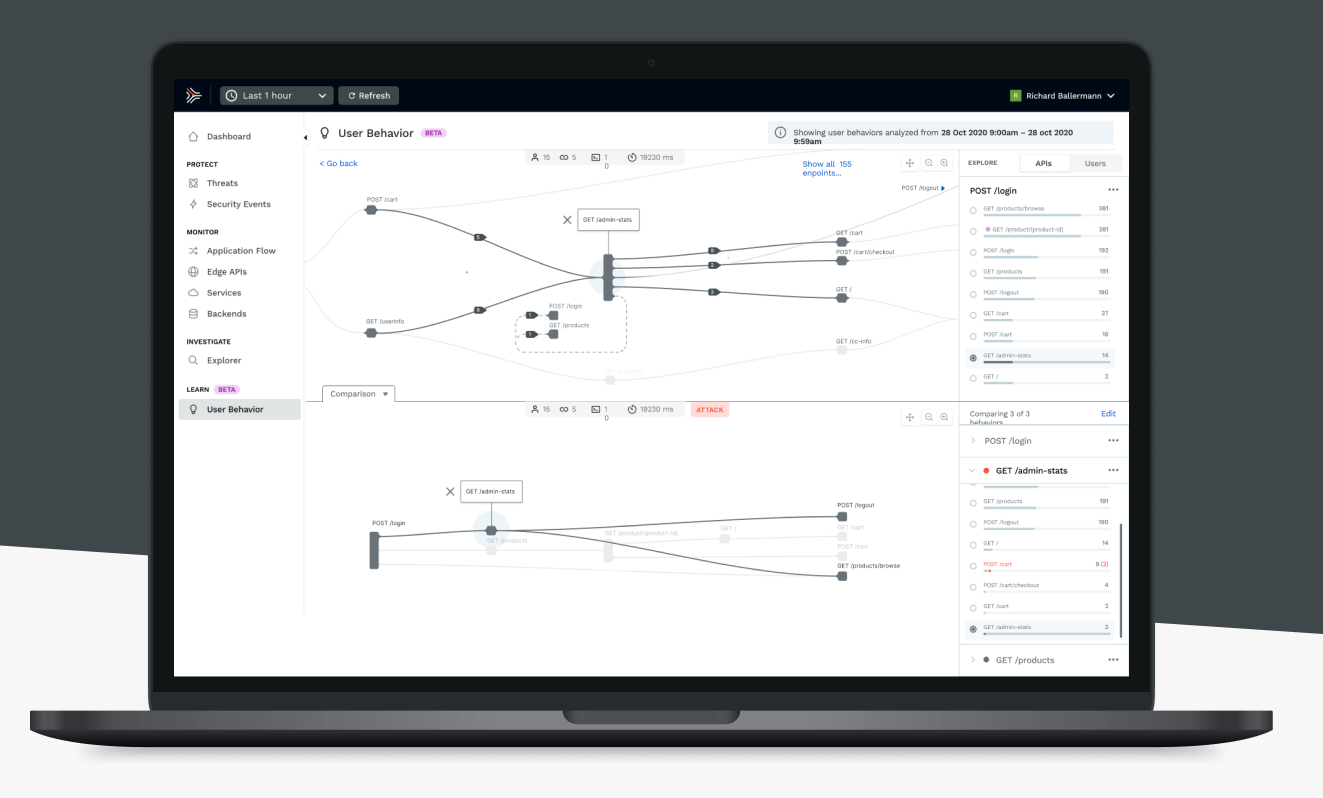
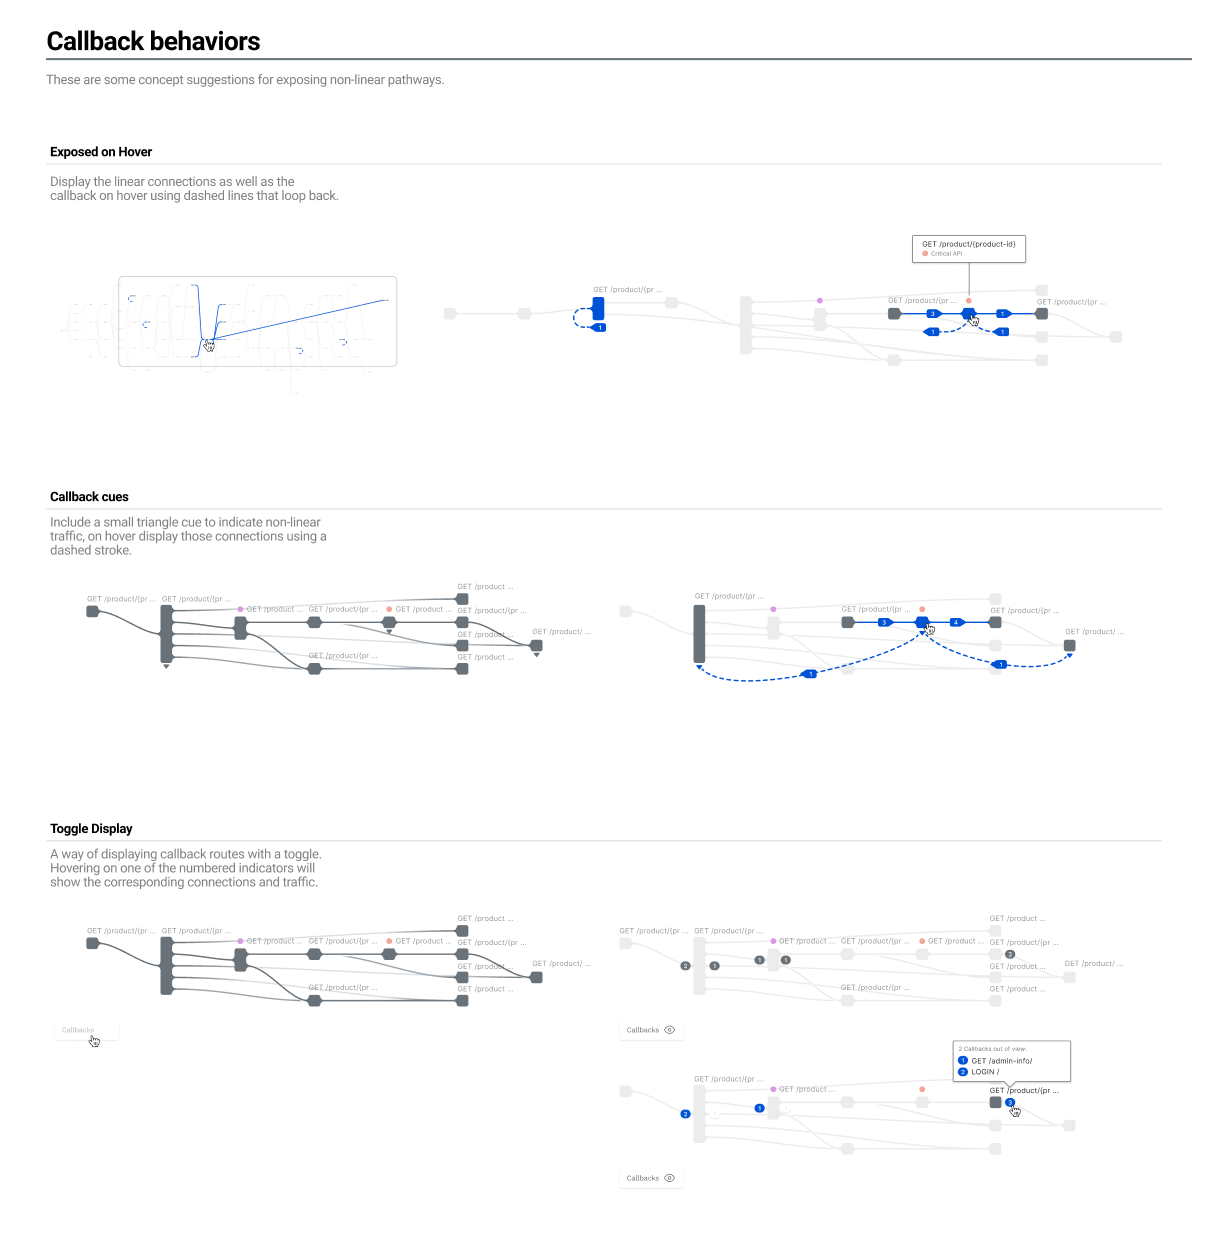
User Behavior Mapping
Starting with the basis of a Sankey diagram, the goal for this tool was to give infosec teams a way to visualize complex web-based event activity to better understand conditions that could lead to system vulnerabilities.
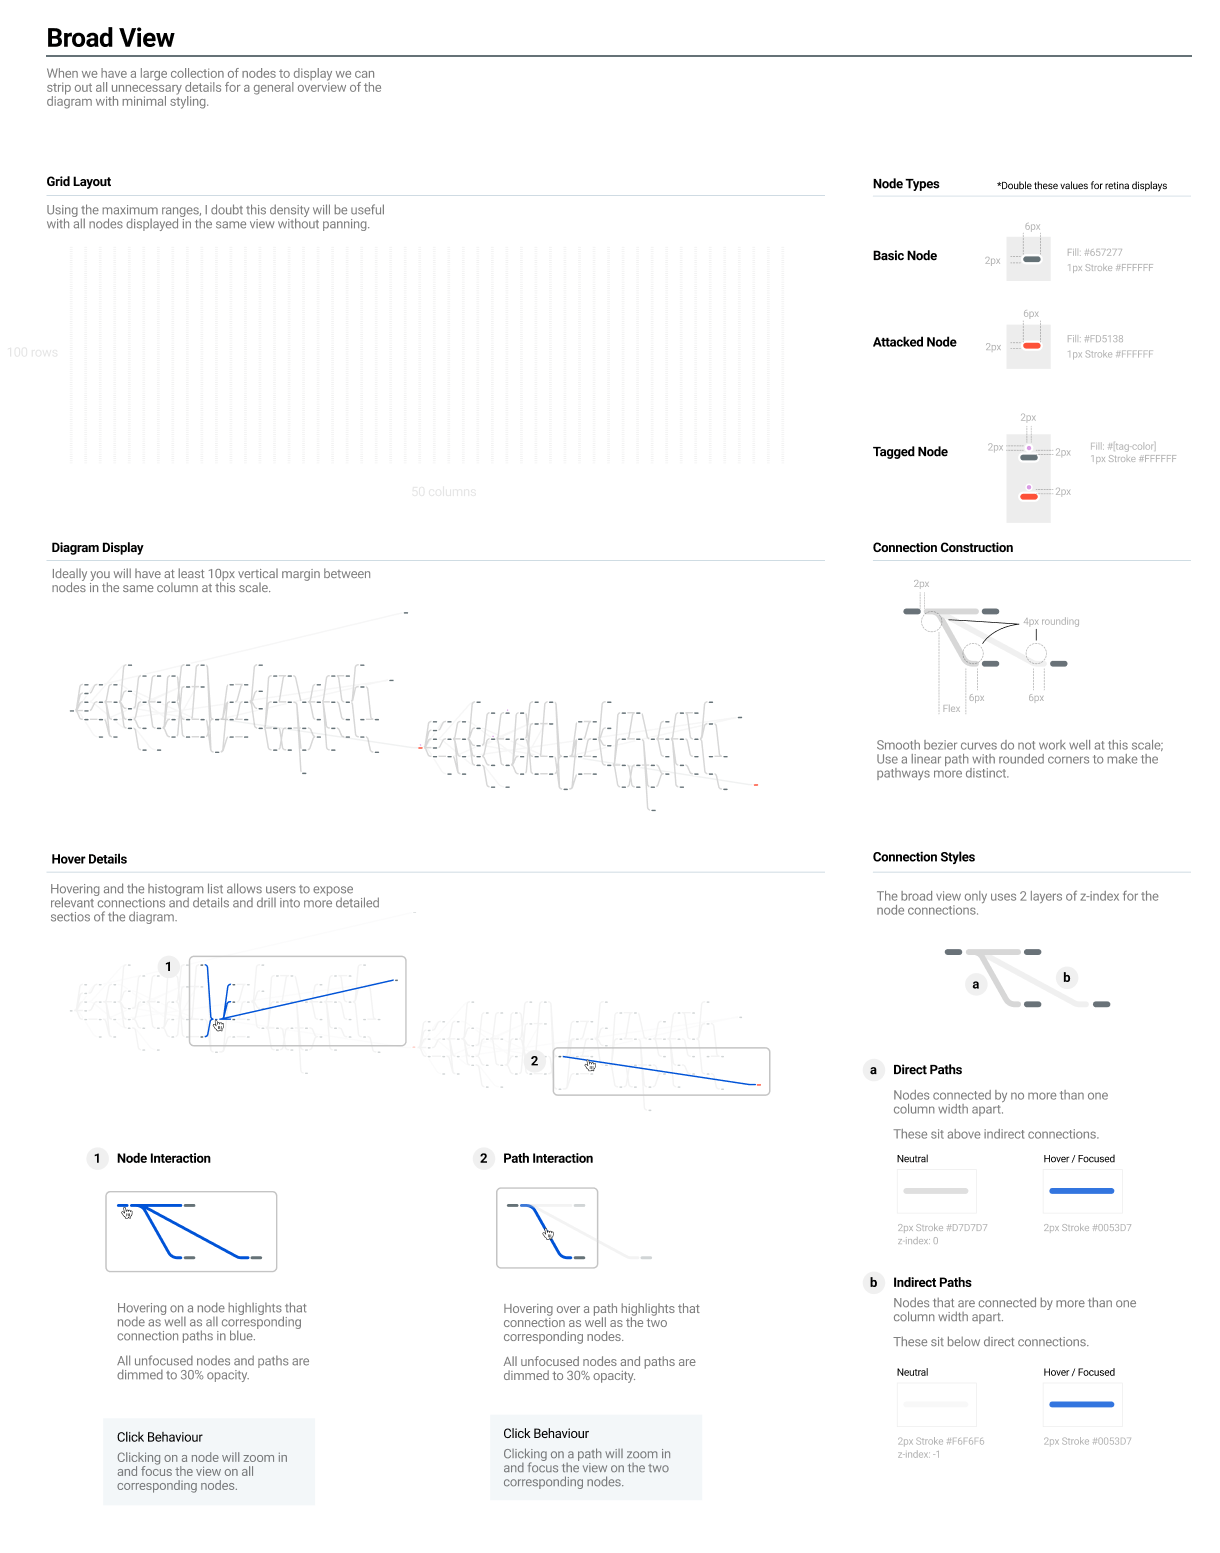
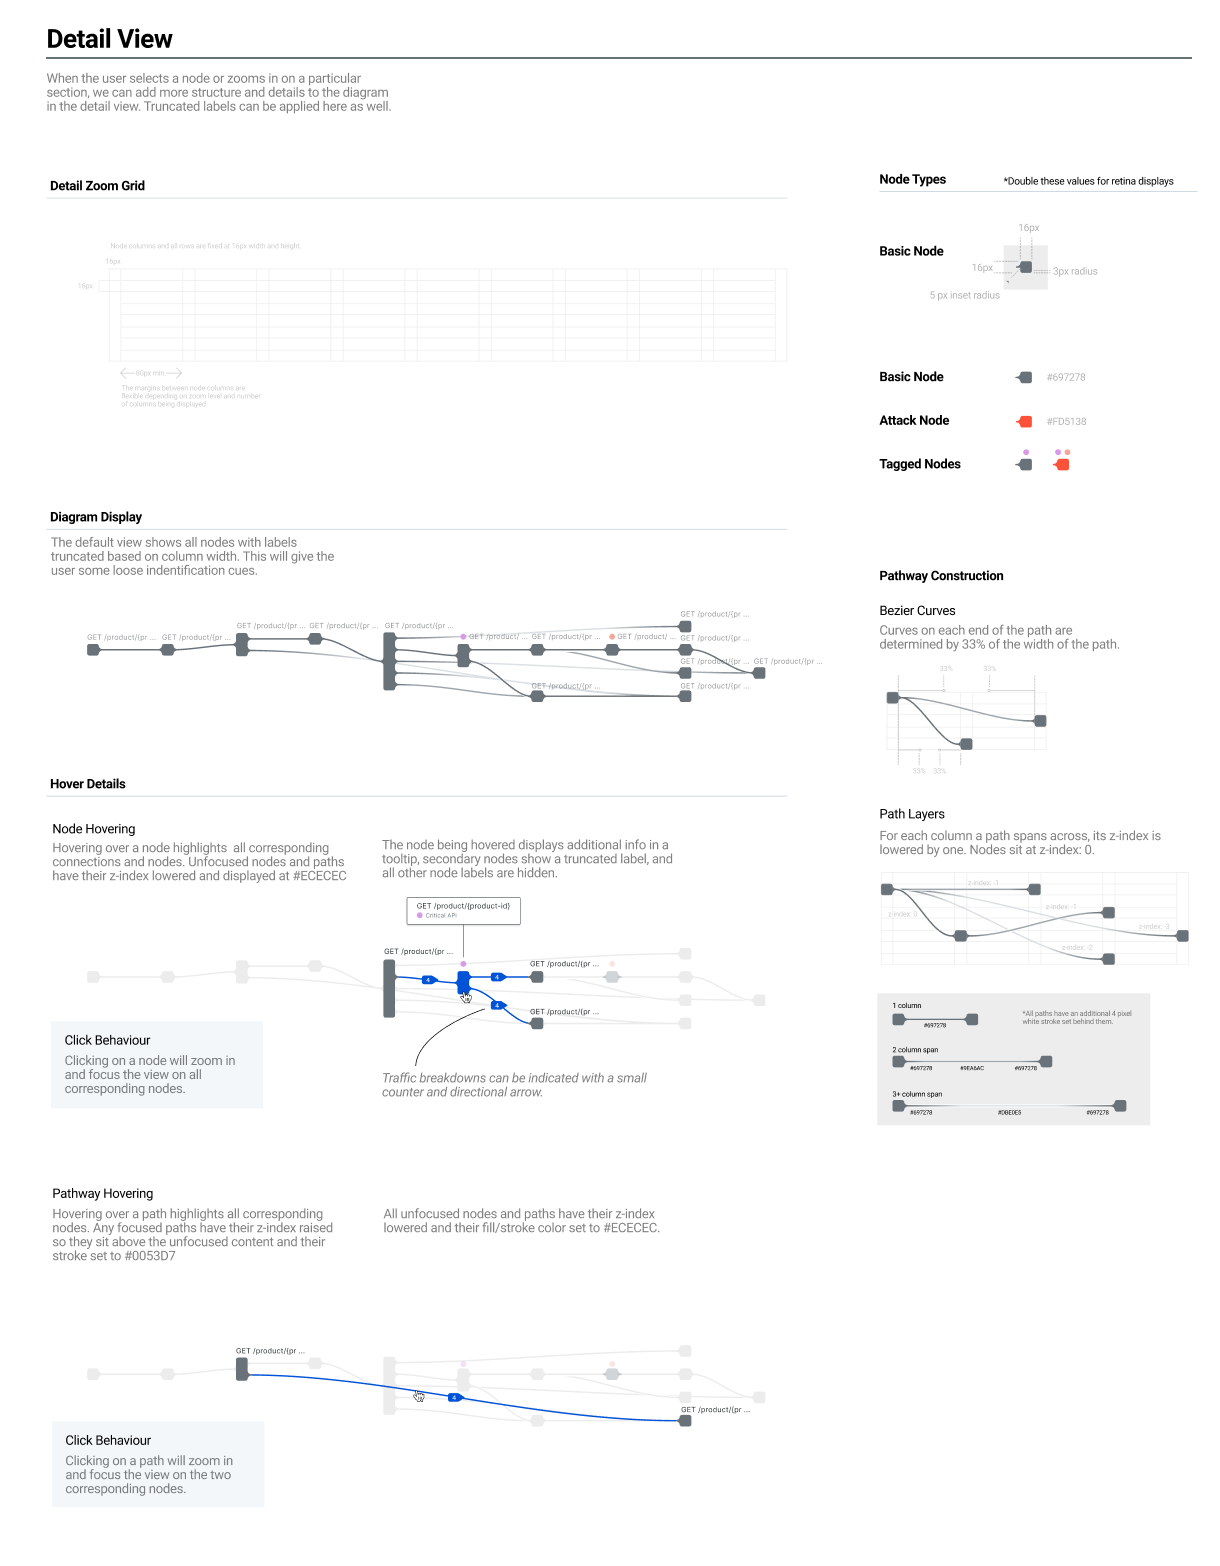
A lot of effort was put into defining styles for a team of developers to explore.
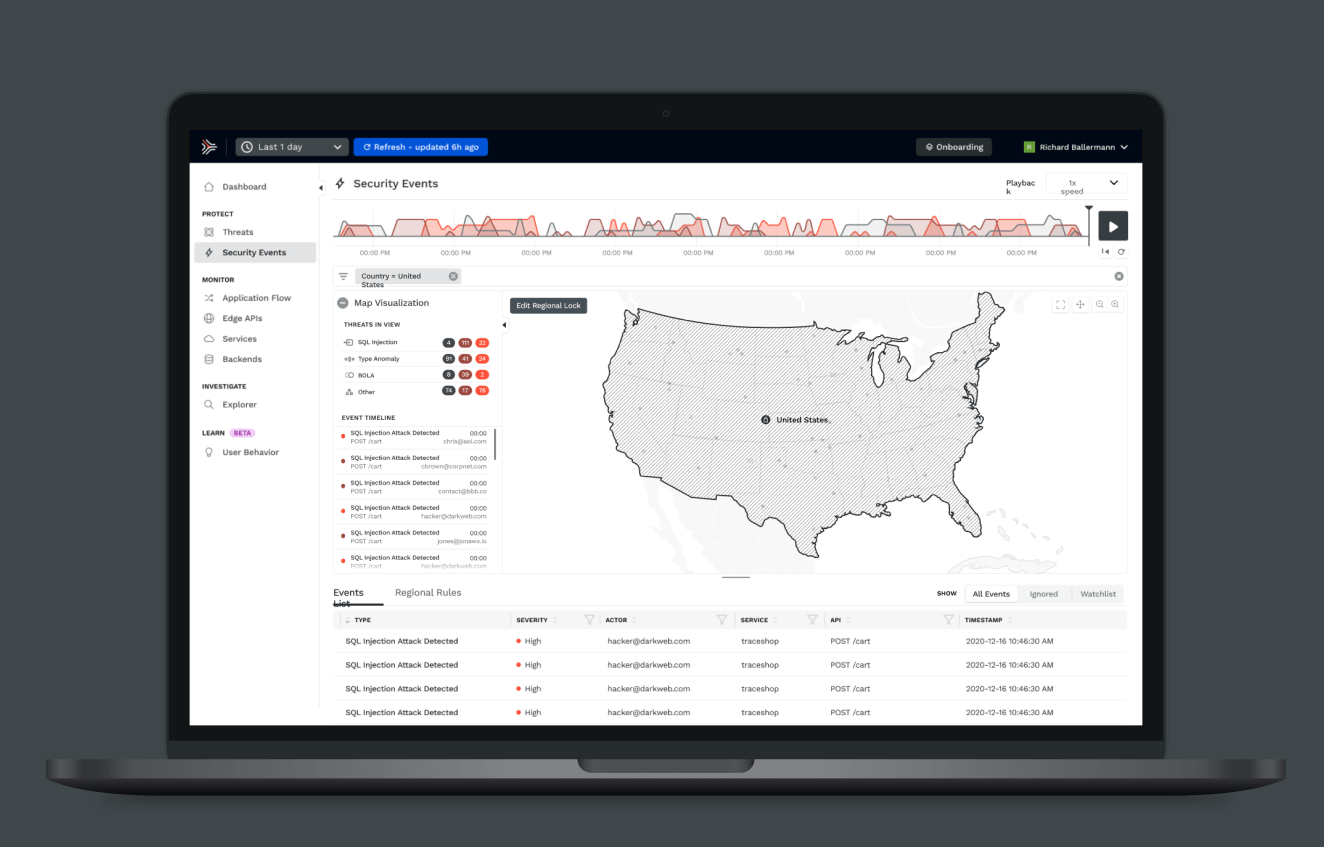
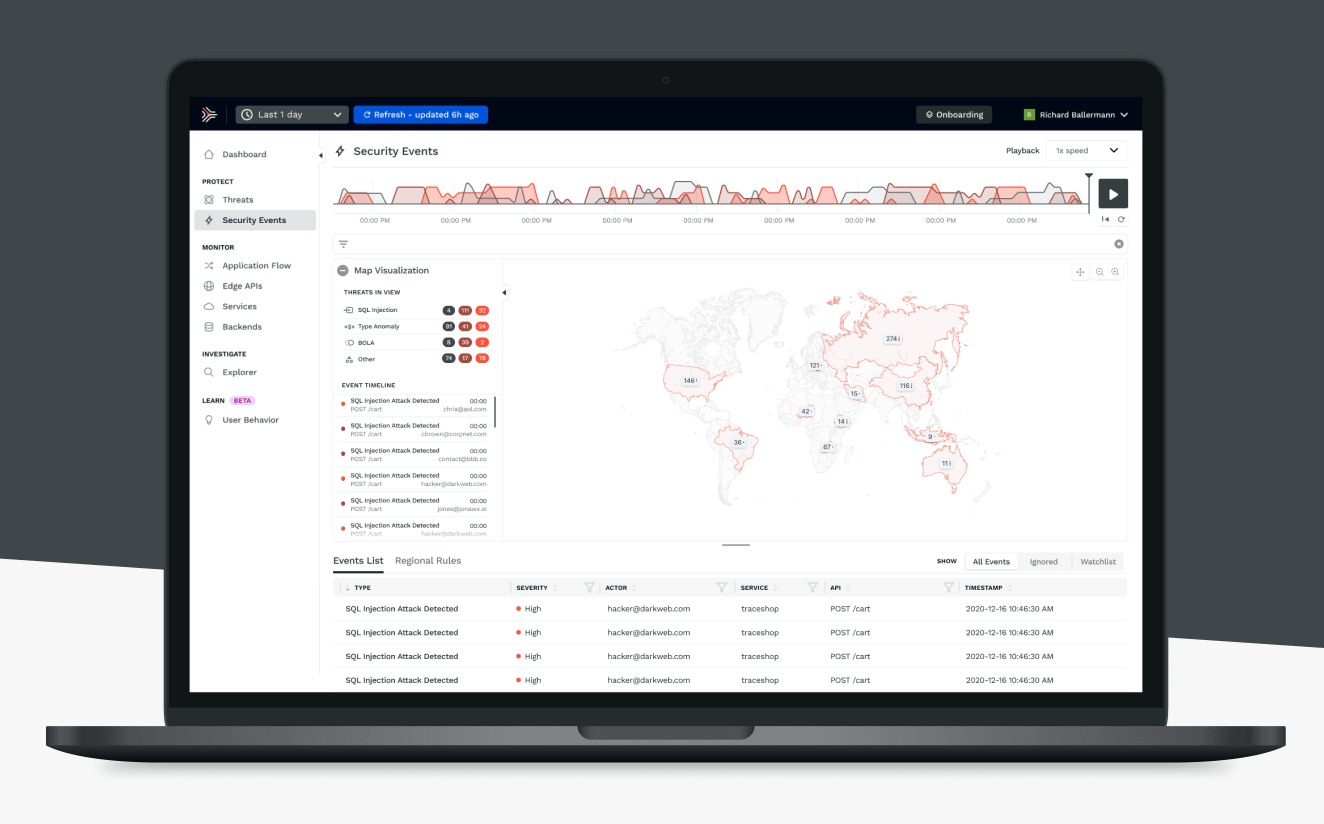
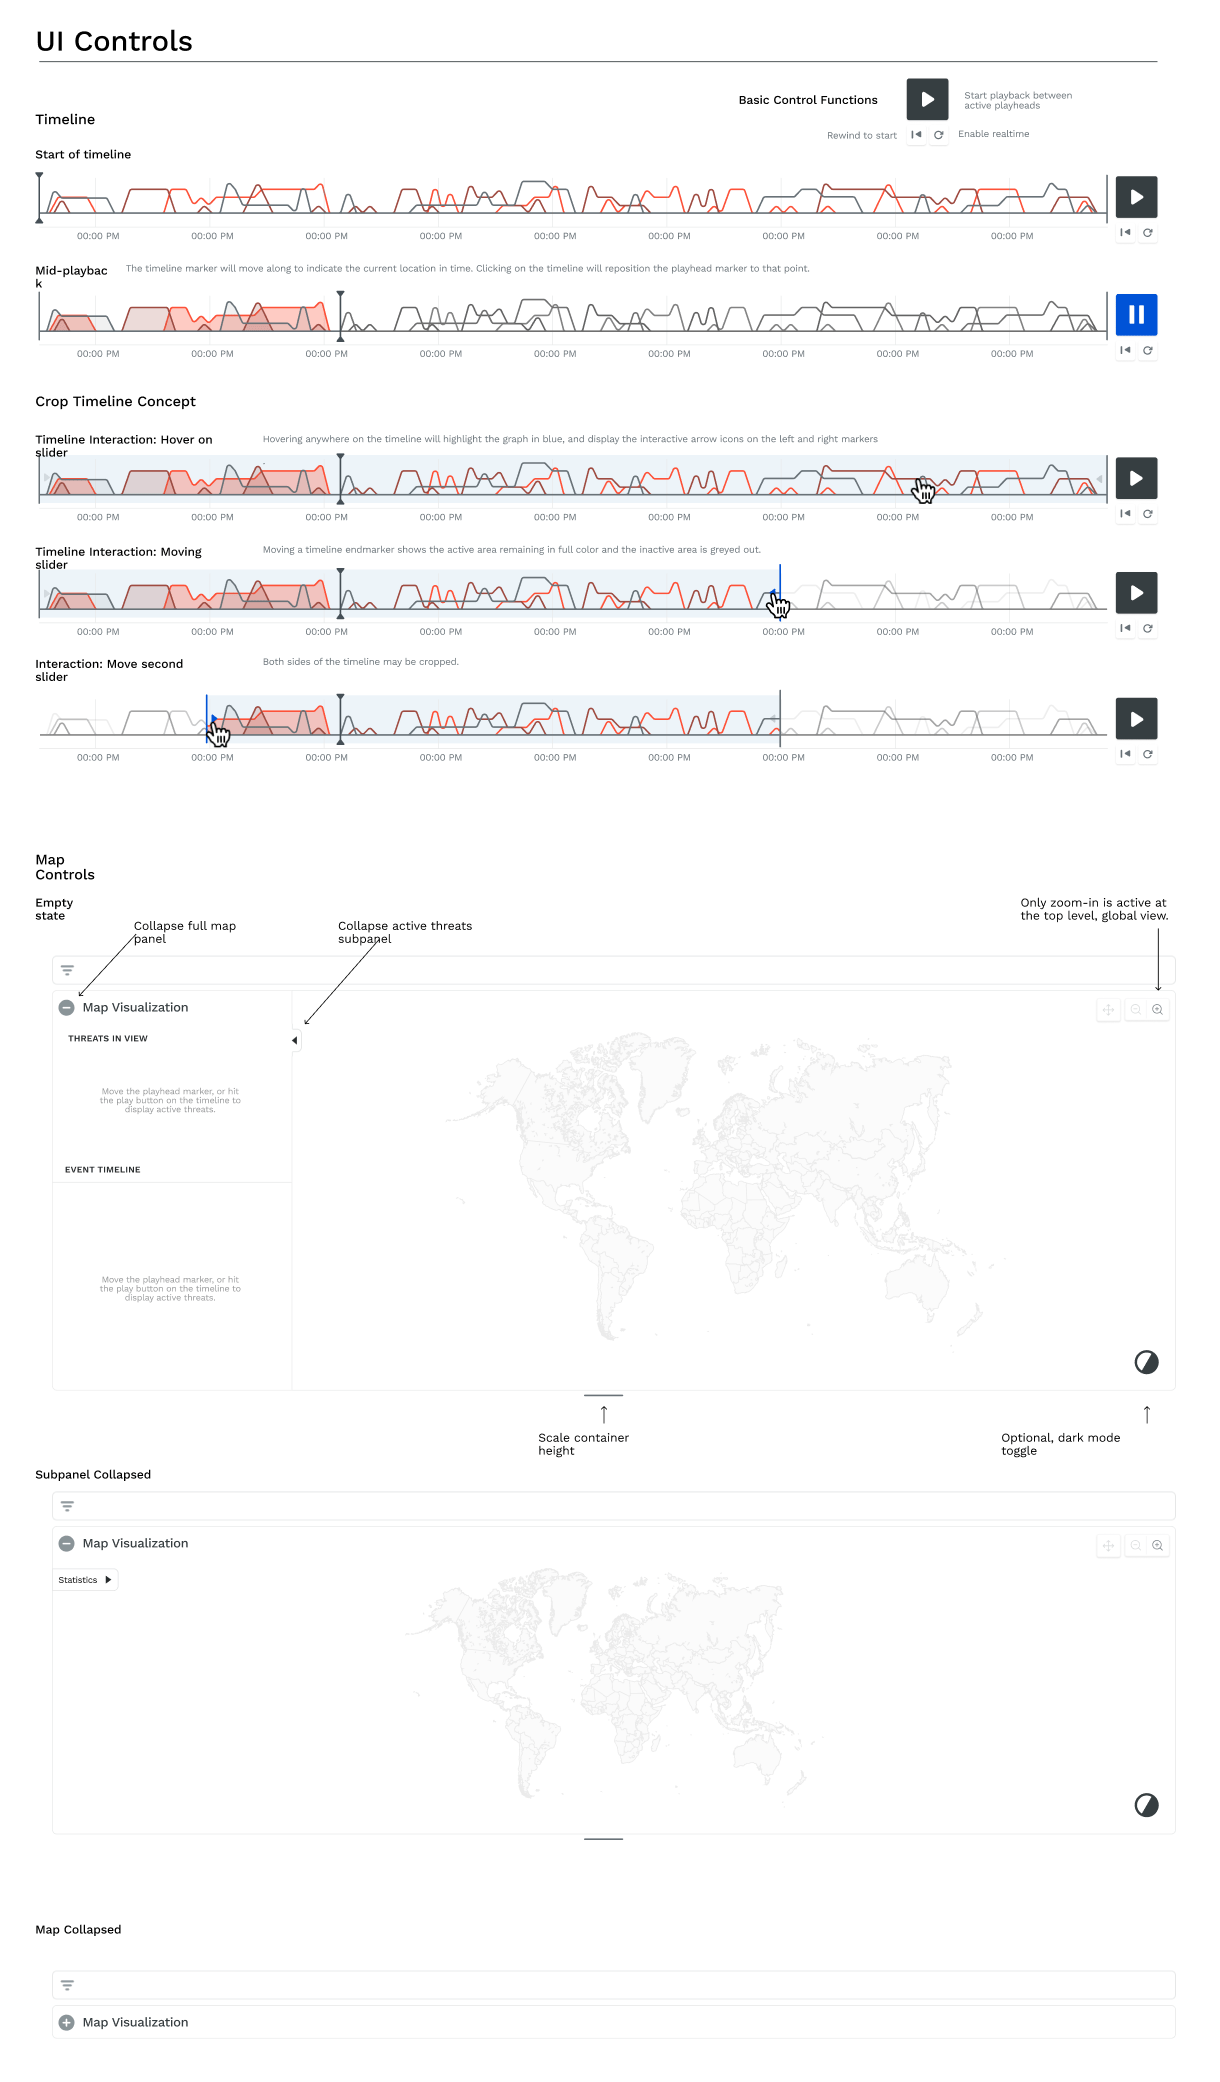
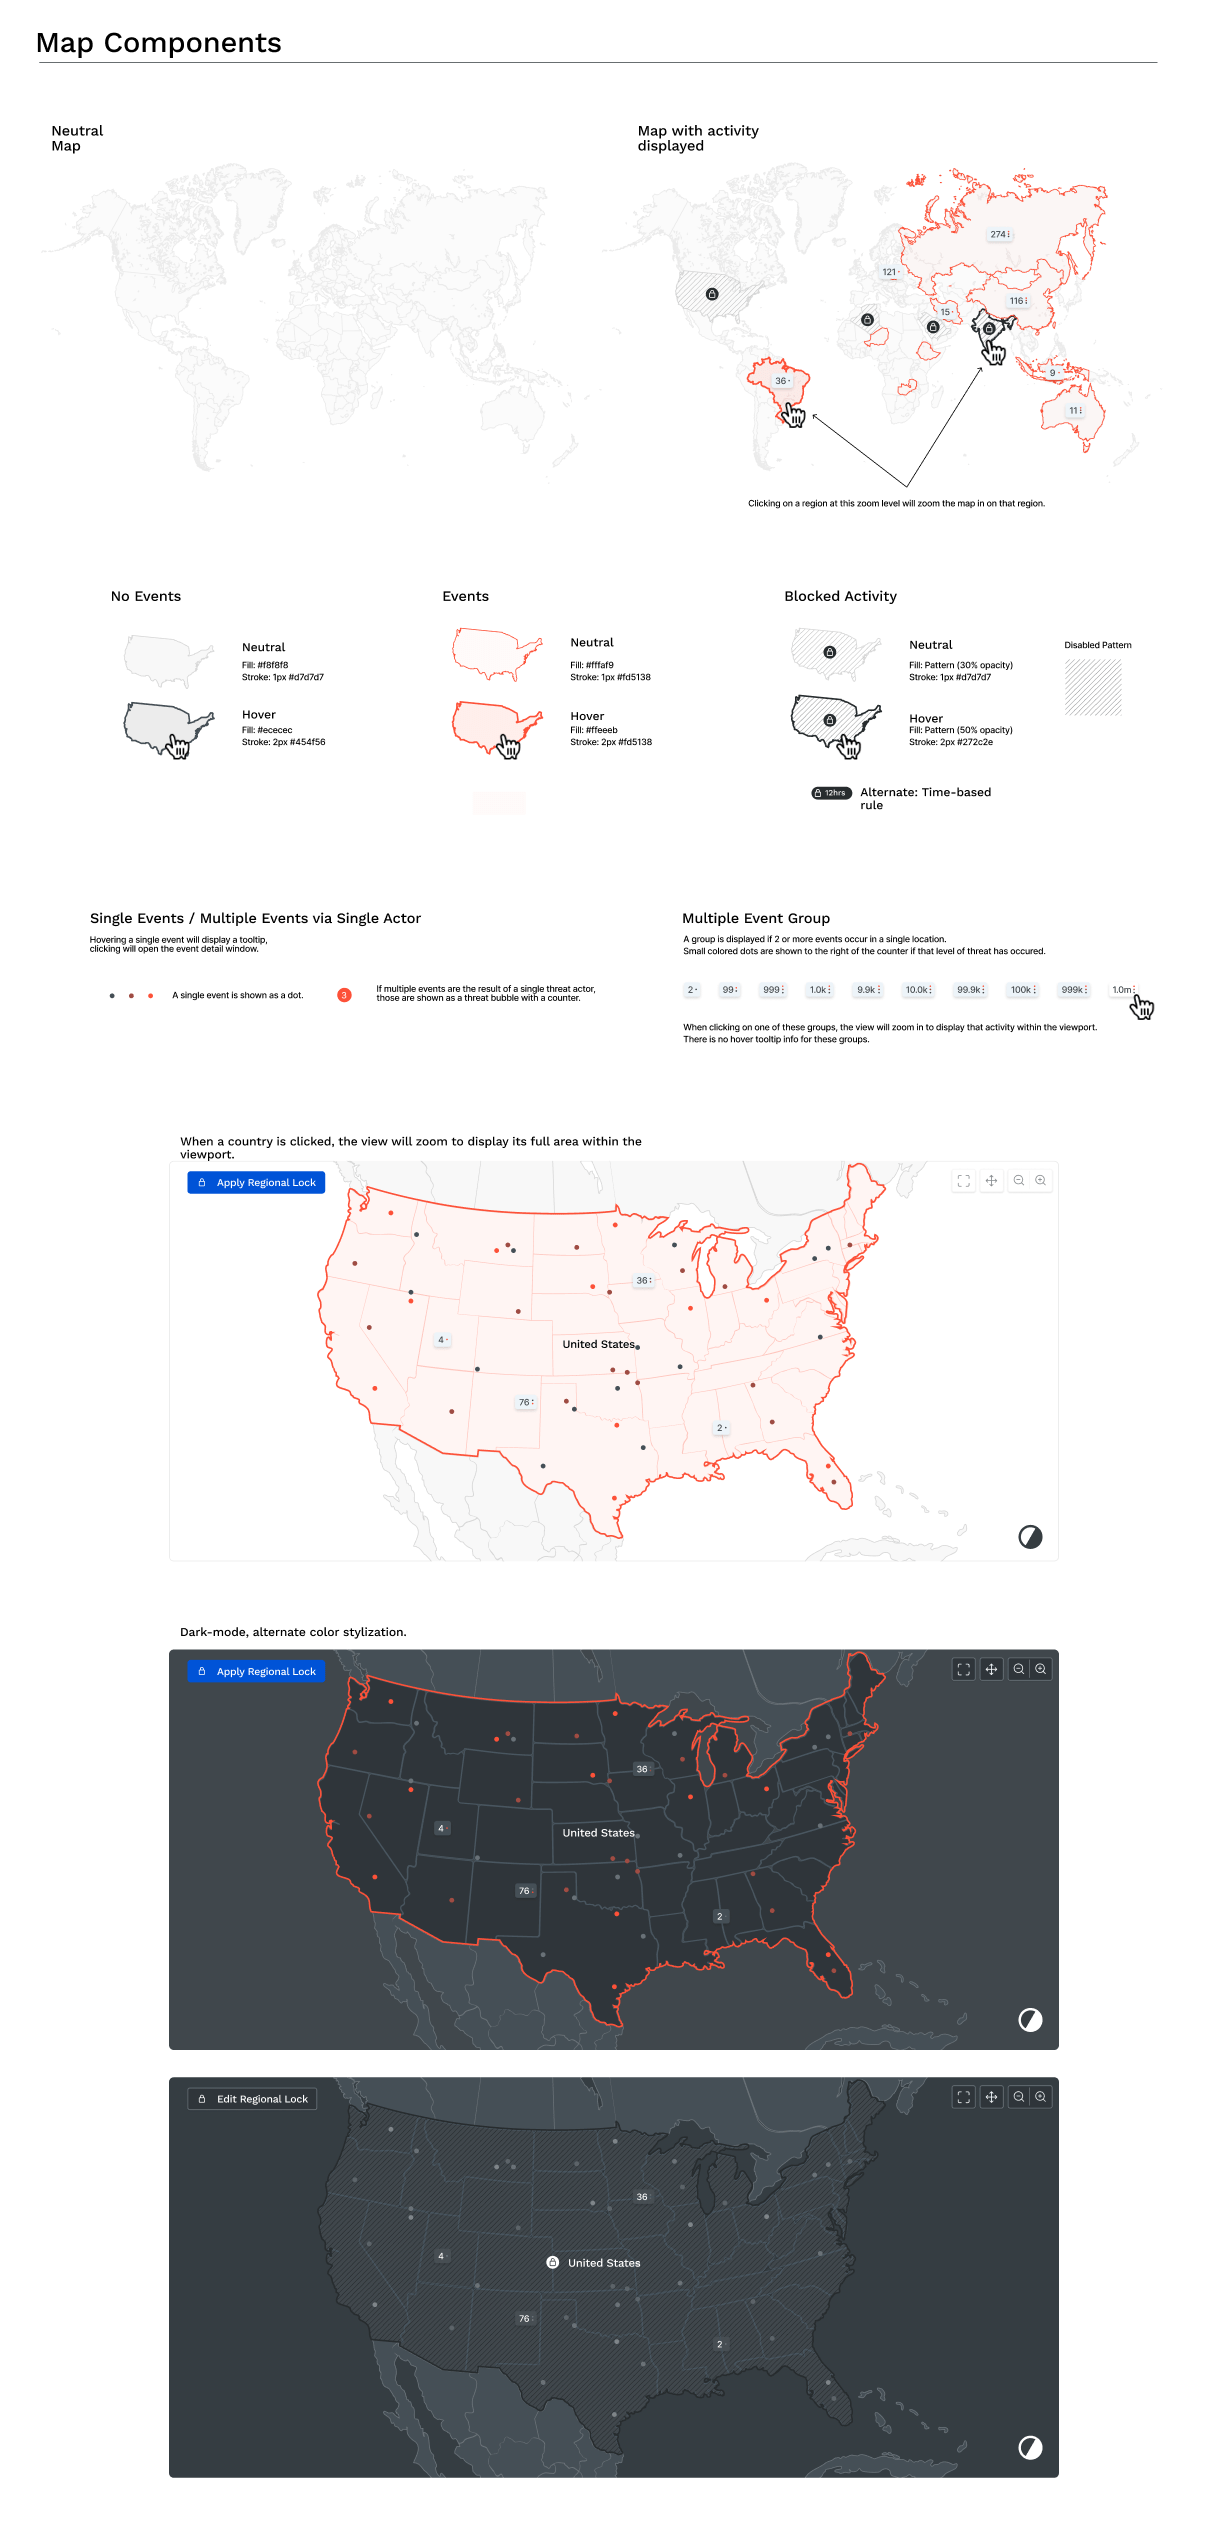
Global Threat Map
The threat map introduced the concept of time-based data that would update along with the interactive map controls that included targeting, and filtering of content. These screens were no doubt visually dense, but we came up with a solution that organized a lot of detail within a one screen.